Hello again! Another week, another article from Cozy Data Pub!
Intro
Following our latest article, where we showed the steps someone typically follows to fetch and visualize data using Power BI Desktop, we are moving on to show how we can do further data transformations directly in the report layer.
This is where DAX comes in handy.
What is DAX?
DAX is the programming language of Power BI and the initials are translated to Data Analysis eXpressions. It is used to calculate business formulas on top of the data model we have created. Most of the times, this is the case as we are called to apply additional business logic to the data we have prepared for our report.
We have two important concepts to distinguish here:
- Calculated Columns
- Measures
Even though DAX is used to calculate both of the above, there are differences between them.
Calculated Columns
Calculated Columns can be used to add a new column in your model but instead of loading them from the source or calculating them in the data transformation stage with Power Query, you can use DAX syntax to calculate them. Then you can use them similarly to any other column in the table.
Measures
Measures can be used so that we can do different calculations – such as aggregations – over columns in a table. Unlike calculated columns that compute a value for each row, measures can be used to aggregate many values of the same column.
Let’s put these two concepts in context with the following example.
We are going to use the same model that we used in our previous article. (be sure to take a look here)
Calculated Columns & Measures in Action
In our previous article, we resulted in the following table.
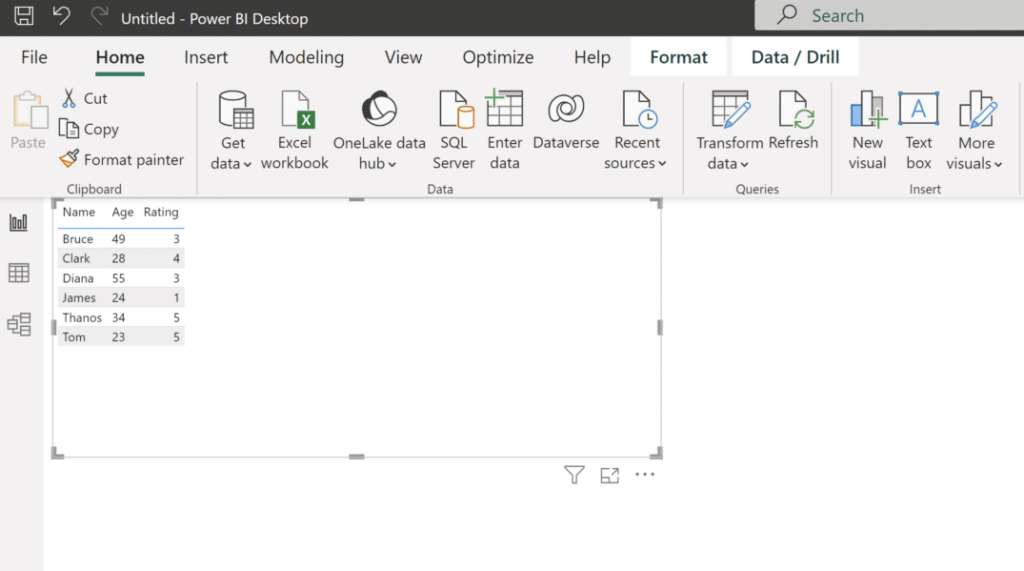
This table is showing the Age and the Rating for some customers. Let’s say, that we are asked to depict the Rating, which is from a scale of 1 to 5, like this: 3/5.
One way to achieve this, is to use a calculated column in the Rating Table. We can do that as seen below:
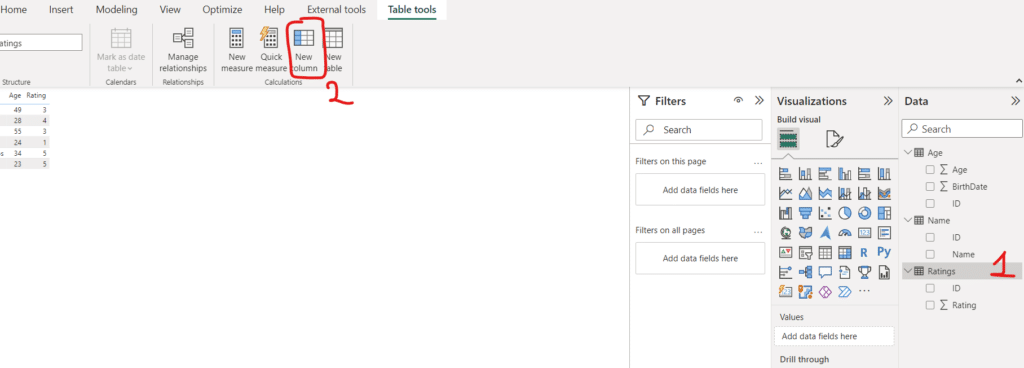
We first select the table where we want to create the calculated column (1) and afterwards we select from Table Tools the option New Column (2).
After that we write our formula to the pane that appears.

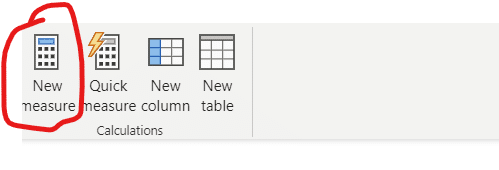
Suppose that now, we want another table, that shows the ratio of each rating to the total ratings. For this we are not going to use a calculated column but a measure.
First we create the measure by pressing the New measure icon in the Table Tools. The measure will be created under the table selected (in our case the Ratings table), but unlike calculated columns, a measure can be moved to a different table.
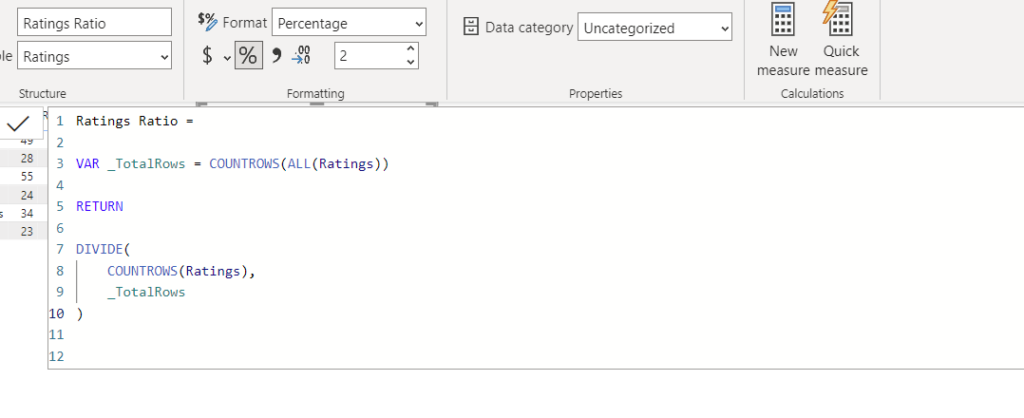
After that we type in our formula. This formula first calculates the total number of Ratings and then for each Rating it calculates the ratio.
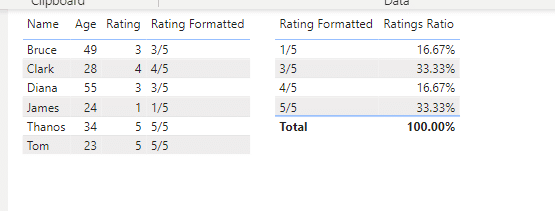
Finally, we can see below the result for both of our new Ratings column and the ratios.
Conclusion
In this article, we tried to highlight the differences between a calculated column and a measure. Both of them are calculated using DAX syntax but the interesting part is the evaluation context under which they are calculated. As we have seen a calculated column can be computed in a row level whereas a measure is an aggregation of values (rows) from a column and highly depends on the filtering and user selection in the report layer.
Additionally, keep in mind that even if we can create a calculated column this does not mean that we should always do so. Performance wise there are a lot to consider in order to decide whether to create a column in Power Query or directly in the report layer.
Moreover an equally important part is how we format DAX, so that it can be easily readable first of all by us and then for others who will read our code. Further below i have added some links that they have to do about DAX formatting and some rules that we should follow.
Finally, if you are interested in learning about DAX, I highly urge you to read “The Definitive Guide to DAX” by Marco Russo and Alberto Ferrari. When this book was suggested to me by a very good colleague of mine, it was (and still is) an eye opener regarding DAX and the engine that it uses.
And that wraps up this week! Now time to hurry and make it to the Barbie movie screening!!