
Hey Folks!
Here we are this week with another article! We continue our introductory articles in Power BI. In this article, we will explore the Power BI Service.
Intro
Let’s do a recap until now. In our first article, we got an overview of the different offerings of Power BI. In our second article, we got a view how to bring data into Power BI desktop and examined the transform-model-visualize aspect of data. In our last article, we have discussed about calculated columns and measures.
What we are going to do if we want to share the report we have made with other colleagues? It is time to use Power BI Service.
Power BI Service Overview
Microsoft Power BI Service (or Power BI online) is the SaaS part of Power BI. SaaS stands for Software As A Service. It is the place where we publish the reports built in Power BI desktop. Typically this consists of the common workflow but it is feasible to create reports directly in Power BI service. After publishing the reports users can view & interact with them, hence the collaboration aspect of Power BI Service.
With Power BI service we are entering in the realms of licences and different offerings. Be aware that in order to share reports, the other person must have a Power BI licence as well.
Accessing Power BI Service
There are a lot of ways to access Power BI Service. The ones I usually use and have bookmarked in my browser are:
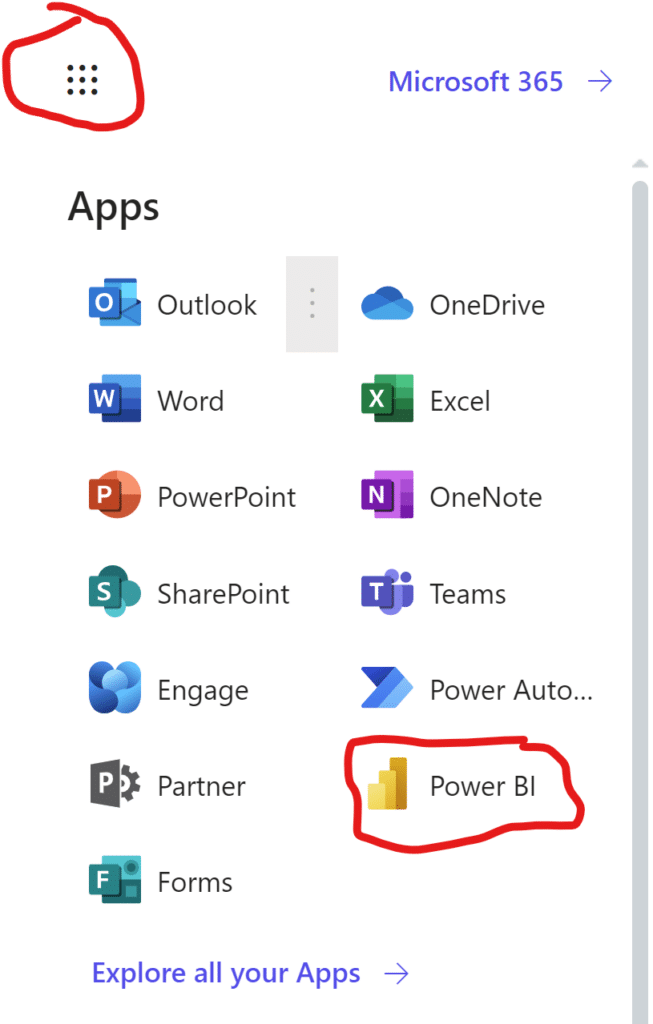
- From office.com, and provided that you have a Power BI license assigned to you, by clicking the squared dots on the left you can find Power BI
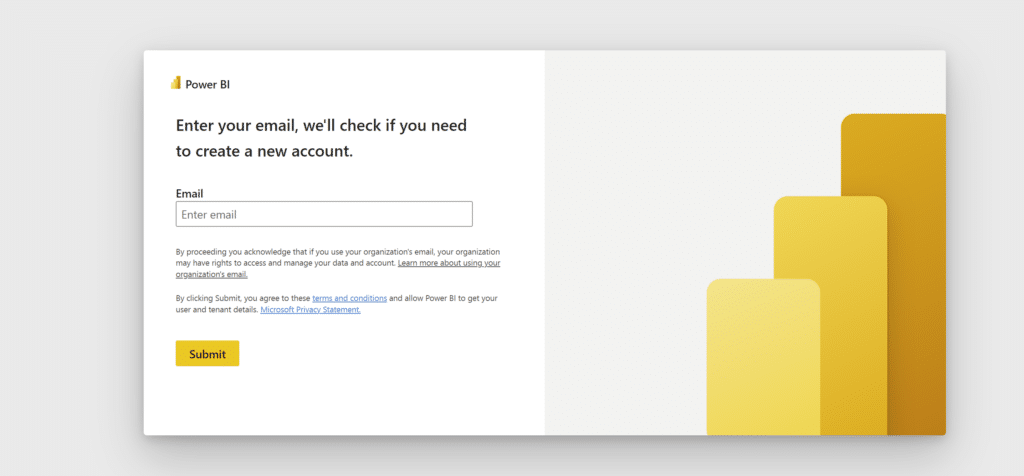
- From Power BI portal and provide your email associated with your Power BI license.
Navigating through Power BI Service
After entering in Power BI Service, you will probably see something like below:
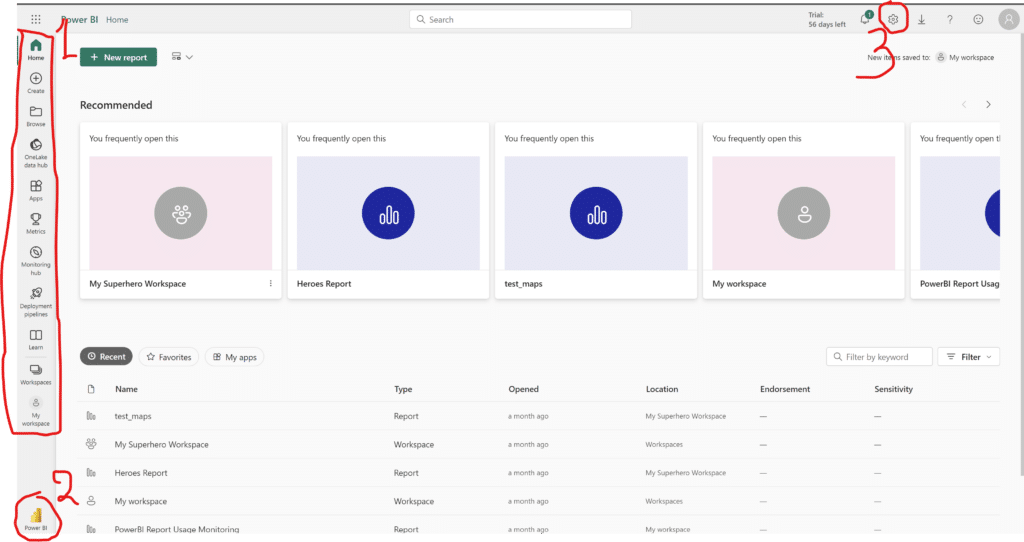
Let’s get a brief overview of some of the components (numbered with red):
- One – This is the main navigation icons of Power BI, where you can browse for published content in Power BI, monitor if dataset/dataflow refreshed as expected or deployment pipelines (available in certain offerings) ran successfully. Additionally you can access different apps/workspaces that you were given access to or that you built.
- Two – As we have mentioned in our first article, Power BI is as well part of the all in one platform for analytics, called Microsoft Fabric. By having a Fabric licence, you can navigate to different products of the Fabric ecosystem.
- Three – By clicking on the settings icon, you can set your preferences and manage different areas of Power BI. Additionally if you are given admin access, you will have access to admin portal and there you can modify a lot of settings in administrative level for all users of Power BI.
Creating a workspace in Power BI Service
Now that we got a brief overview of Power BI Service, we can move on and publish our first report in Power BI. For our example, we will use the report we have created throughout our previous articles of this series.
Our first step is to give to our report developed in Power BI Desktop a name, so we will save our report as Ratings. In the meantime we should create a workspace in Power BI Service, where we will publish our report. There is My Workspace of course where we can publish things but this is only for us. This workspace can’t be shared with someone, it is only for our view.
Let’s see how we can create a workspace in Power BI Service.
It is somewhat intuitive, but let’s describe the procedure step by step.
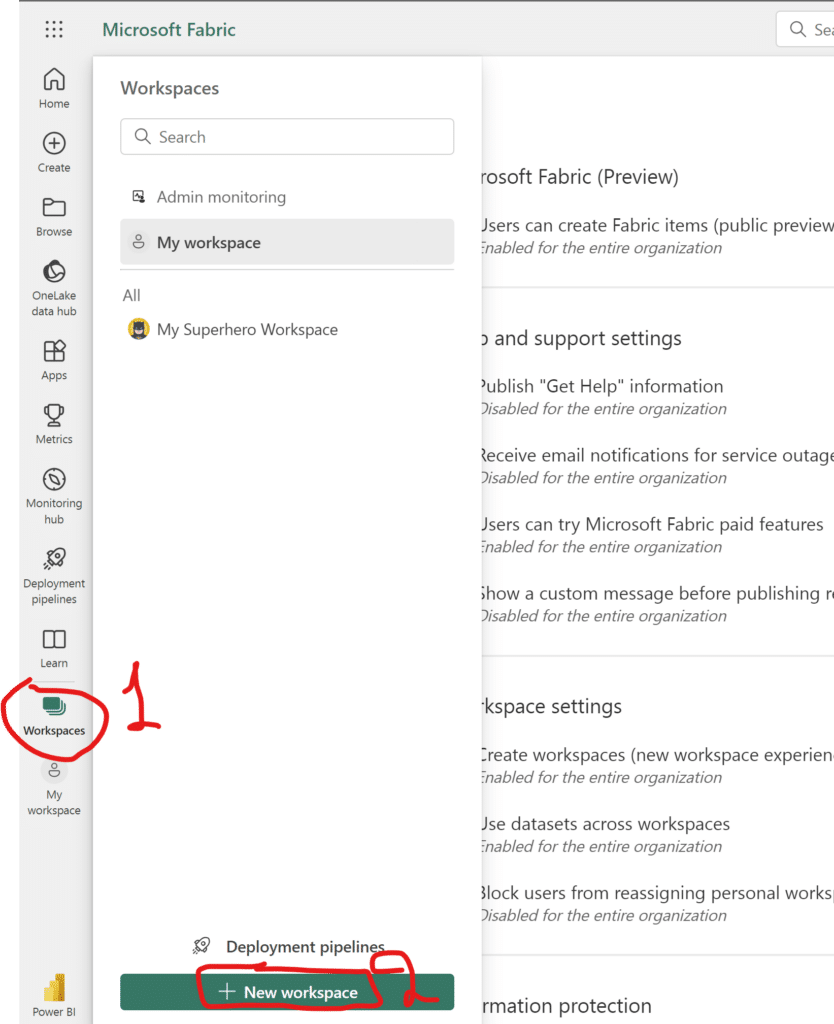
First we press on the Icon “Workspaces” from the icons on the left and after that we click on the green button “+ New workspace”.
After hitting the button, another window appears, which prompts us to input the desired name of our workspace. Suppose that we are building this report for Marketing department (we will not go through the advanced section for this demo). Additionally we can upload an image for our workspace and a description. After entering the above details, we hit Apply.
A new screen appears that shows the contents of your workspace. Obviously nothing is there yet!
Publishing content in Power Bi Service
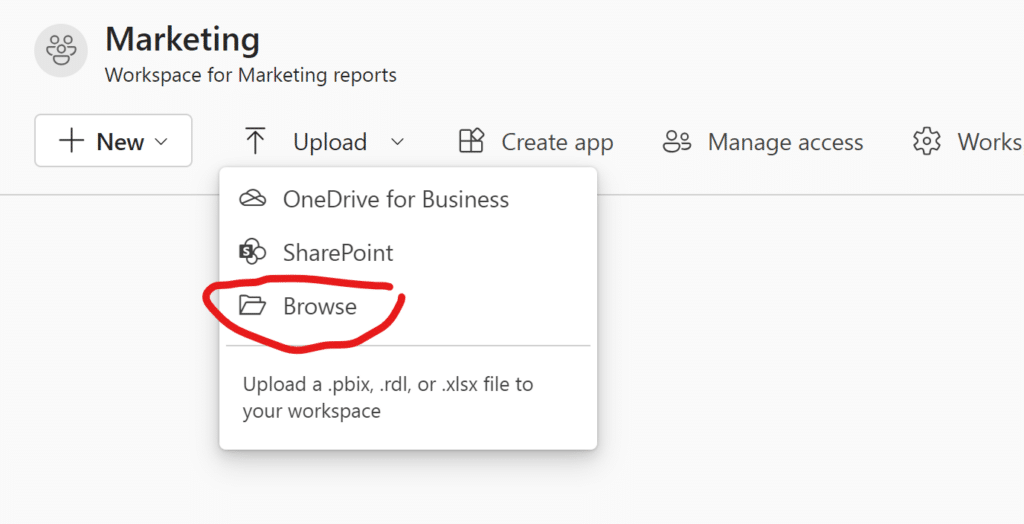
There are two ways with which you can upload a report in Power BI Service. The first one is directly through the desired workspace and hitting the upload button.
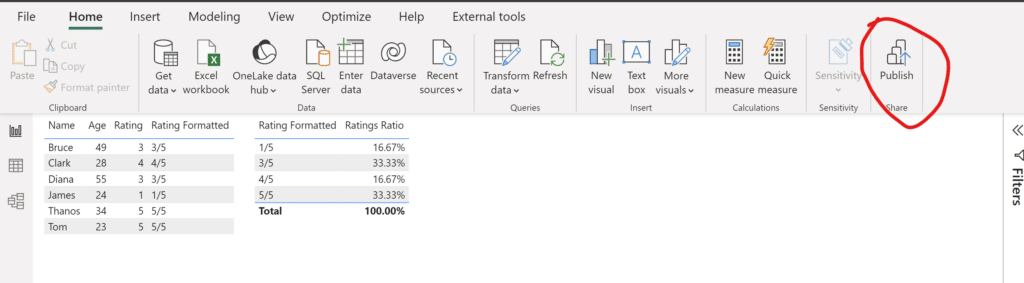
Alternatively by publishing the content from Power BI Desktop (provided that you are signed in your Power BI account) by hitting the “Publish” button and selecting the desired workspace where you want to publish your report.
If we now go to our newly created workspace, we will see two files inside, with the same name but different in kind.
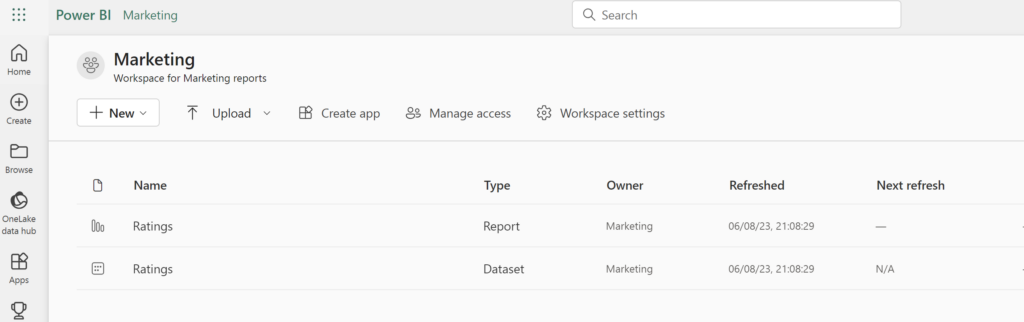
The first is our report containing all the visuals we have created. The second one if you open it does not contain any visuals but shows you the report(s) that are associated with it. In fact the second file is the dataset, which contains the model i.e. the relationships between the tables, all the transformations prior to loading the data, and all the measures and calculated columns. Moreover for this file we can tweak some settings, such as setting a refresh schedule (i.e. when the dataset will synchronize and fetch new data from the sources).
Finally, by clicking on “manage access”, you can add the emails of the people you want to access the workspace. By assigning them different roles, you are controlling what is being shared with them and what they can view/edit.
Conclusion
In this article, we have gotten an overview of Power BI Service and how we can easily share content. Of course there are a lot more to cover about how you are properly sharing content within a company and what different ways you should follow so that you can set the rules of how the various roles of Power BI users consume & interact with Power BI content. This article offered an introduction to the Power BI Service and demonstrated how easily content can be published and shared.
And that’s it for today!
P.S: If you’ve made it this far and you like hidden meanings and easter eggs, i suggest you should check the photos that accompany this and last article. Can you guess with what they are connected? I shall leave you to your thoughts and reveal the answer next time!
Until then… Bye!
Related Links


3 thoughts on “Ignite Data Magic: Power BI Essentials – Part 4”
Spot on with this write-up, I truly believe that this
website needs a lot more attention. I’ll probably be back again to read through more, thanks for the information!
Feel free to visit my homepage John E. Snyder
Thanks John, really appreciate it! Truth is, this year didn’t have time to write any new articles, but I plan refreshing this website with new content soon!
We’re a group of volunteers and starting
a new scheme in our community. Your site provided us with valuable information to work on.
You’ve done an impressive jobb annd our whole community will be grateful to you. https://evolution.org.ua/